 |
| Wind Farm operation |
| · Monthly production charts |
| General Info |
| · CRES Wind Farm |
| · Technical specs of the WTs |
| · Monitoring & control of the wind farm |
· Installation photos |
| · Hydrogen Production |
| · Related articles |
3.01 MW Demonstration Wind Farm
Various
Wind Energy technologies in Complex Terrain topography
Location:
Lavreotiki, SE Attica, Greece
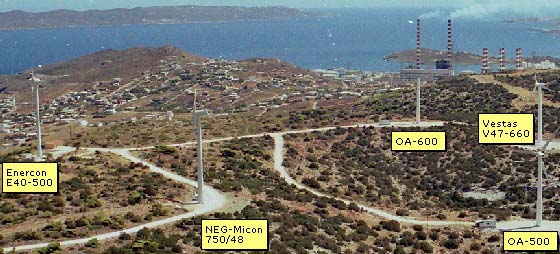
( Photo taken from the 100m high meteo-mast,
situated NNW of the Wind Farm, before the nacelle installation of the
ΟΑ-600 )
On-Line monitoring of the Wind Farm, using a mobile phone:
Send an SMS message with the character ? to +30 6944 560 987 and you will receive instantly the last 10min statitistics of the Wind Farm operation.
Power Output of the Wind Farm and of each wind turbine
Notice:
1. The graphs below do not represent the Power Curves according to the Standards (IEC, MEASNET).
2.The data included to the graphs below come out only from the last 30 days and from one direction sector (that of the last 10min operation).
3. The wind speed refers to each turbine's anemometer. When dealing with the Wind Farm, the average value of them is used.